
Start with the business problem, not a product catalog. Use kW to decide how much site demand the battery must cover at one moment. Use kWh to decide how long it must keep covering that demand. Then increase the installed capacity only enough to account for operating reserve, normal losses, aging and any backup requirement.
For peak shaving, the first two calculations are:
The second formula is only a quick screen for a flat peak. If the load rises and falls, add the energy above the target in each 15-minute row as shown in Step 3. A monthly electricity bill cannot show the peak duration, so use at least 12 months of interval data before choosing a cabinet or multi-MWh platform.
In 2026, Commercial and Industrial (C&I) battery storage — more accurately, a Battery Energy Storage System (BESS) — is no longer a “battery cabinet purchase.” It is an engineered, system-level asset that must survive real-world constraints: tariff structures, interconnection limits, site safety rules, insurance scrutiny, and enforceable performance audits. That is why the best projects treat sizing as a bankability exercise, not a rule-of-thumb estimate.
This guide provides a procurement-grade sizing approach for behind-the-meter (BTM) applications, focusing on Peak Shaving and TOU (Time-of-Use) Arbitrage — and shows how to convert a theoretical kW/kWh calculation into a procurement-ready and financeable system plan.
Power in kW is usually the first constraint. A relatively short-duration battery may be enough.
Energy in kWh grows quickly. Compare storage with load scheduling and efficiency measures.
Set aside separate backup energy and confirm that it has not also been counted as available for peak shaving.
1. Core Concept: Power (kW) vs. Energy (kWh)
The most common ROI failure in C&I storage comes from confusing two core metrics:
- Power (kW): Discharge rate. Determines the maximum peak demand reduction you can achieve within a billing window.
- Energy (kWh): Usable capacity. Determines how many consecutive intervals (duration) the battery can sustain that discharge.
The ROI rule:
- Peak shaving is typically kW-led (cutting the spike).
- TOU arbitrage is typically kWh-led (shifting energy volumes).
A bankable design balances both while accounting for SoH (State of Health), operating reserve, and real-world constraints.
Think of electricity as water. kW is the width of the pipe: it tells you how much power the battery can supply at once. kWh is the size of the tank: it tells you how long that power can continue. A large energy number does not help if the system cannot deliver the required power, and a high-power system does not help if it runs out before the peak ends.
2. Data Foundation: Why 15-Minute Intervals Matter
In many C&I markets, 15-minute interval data is a common baseline for demand analysis and ROI simulation. This granularity aligns with typical demand-billing practices and captures volatility in modern sites — especially those with EV charging hubs, automated manufacturing, or batch-driven processes.
Minimum dataset checklist
- Load data: 12 months of 15-minute site demand (kW)
- Tariff structure: demand charges, TOU bands, and demand ratchets (if applicable)
- Site constraints: transformer capacity, export/zero-export requirements, siting and safety constraints
- Recharge window: whether off-peak hours allow recharging without creating new peaks
One row should represent one 15-minute interval and include a timestamp plus site demand in kW. Keep the original timezone, identify missing intervals and note shutdowns, holidays, production changes and solar commissioning dates. If several meters serve the site, state whether the analysis should use the whole site or one feeder.
Common data mistakes that distort ROI
- Using monthly bills only (no interval data)
- Ignoring ratchets, seasonal rules, or demand-charge definitions
- Assuming export revenue without confirming it is permitted and financeable
- Oversizing kWh without verifying recharge limits and transformer capacity
Procurement reminder: ROI is often strongest at sites with a high peak-to-average load ratio and significant TOU price spreads.
3. Step-by-Step Sizing: From Data to a Theoretical kW/kWh Range
Step 1: Identify your “Peak Profile”
Review your 15-minute data to classify peak behavior:
- Spikes: short, sharp peaks (often high kW, relatively low kWh)
- Plateaus: sustained high loads (kWh requirements rise quickly; ROI can diminish)
Guidance: Many sites start by shaving the top 10–15% of peaks. Attempting to shave extremely deep peaks often leads to rapidly increasing kWh needs and diminishing returns.
Step 2: Size required power (kW)
For each 15-minute row, subtract the target grid demand from the measured site demand. Ignore negative results. The largest remaining number is the starting battery power requirement.
Example: To cap a 1,000 kW peak at 750 kW, the starting discharge power is 250 kW.
Step 3: Convert power to usable energy (kWh)
If the excess load stays flat, a quick screen is power × duration. Example: a constant 250 kW requirement for 1 hour implies 250 kWh usable. Real peaks usually rise and fall, so use the 15-minute rows for the better calculation:
This adds only the energy above the target line. The 0.25 converts each 15-minute interval into one quarter of an hour. Do not confuse the utility’s 15-minute billing interval with the total peak duration: a peak can continue across several intervals.
Step 4: Apply correction factors (Usable vs. Installed)
Installed capacity should include margin for:
- AC delivery losses from the battery, PCS and auxiliary loads (e.g., HVAC)
- Operating reserve: maintaining a SoC buffer (often 10–20% depending on strategy)
- Degradation planning: ensure later-year deliverables remain compliant with guarantees, not only Year 1 performance
Use the model’s guaranteed AC deliverable energy for final sizing. Round-trip efficiency (RTE) is still important for recharge energy and TOU savings, but it is not automatically the same as the one-way delivery factor used to convert required AC energy into installed battery capacity.
At this point, you have a solid theoretical sizing range. Next, you must validate it against real-world constraints before trusting the ROI.
Growth-Proofing Your BESS (Scenario-Based Sizing)
Does your 15-minute dataset reflect your future operating reality? If you are adding EV fleet charging, electrified heating (e.g., heat pumps), or new production lines in 2027, size your system with modular expandability in mind to avoid stranded assets and rework. Many bankable projects treat sizing as a scenario exercise (Base case vs. Growth case), not a single-point estimate.
4. Validate Against Real-World Constraints (Feasibility Filters)
Your initial kW/kWh range must pass these feasibility filters — otherwise the ROI model may not be executable or financeable:
-
Interconnection & transformer limits
Can maximum charge/discharge power stay within transformer and point-of-interconnection limits? -
Recharge window
Can the battery fully recharge during off-peak hours without creating a new peak? -
Siting & safety compliance
Does the layout meet spacing and mitigation requirements (e.g., NFPA 855 where applicable), or will additional measures be required? -
Insurance pre-check (2026 gating step)
Based on the preliminary design, can you obtain acceptable insurance terms and premiums? In many 2026 projects, insurability is the ultimate filter that determines whether a design can proceed. -
Export / zero-export control (if required)
If the site cannot export, the system needs fast-acting control logic to prevent unintended backfeed during sudden load drops, impacting PCS/EMS requirements and commissioning complexity.
Go / No-Go Gate Checklist (Bankability Filters)
A sizing range is only procurement-ready if it passes all five gates:
- Gate 1 — Interconnection & transformer headroom confirmed
- Gate 2 — Recharge window validated (no new peak created)
- Gate 3 — Siting & safety feasibility confirmed
- Gate 4 — Insurance pre-check completed (terms/premiums acceptable)
- Gate 5 — Export/zero-export control requirements confirmed
Only the sizing range that passes these gates should be treated as procurement-ready.
The calculation also needs a control plan. See how a C&I BESS EMS coordinates peak shaving, solar and backup reserve. For the electrical equipment and approval path behind these limits, read how a BESS connects to the grid.
5. From Capacity to Solution: A Modular Procurement Path (Pilot → Scale → Deploy)
Once your procurement-ready kW/kWh range is clear, most C&I projects follow a structured expansion path to reduce risk and standardize procurement:
- Pilot & Prove: For smaller projects, evaluate one or more modular cabinets. PVB’s 100 kW / 241 kWh liquid-cooled system is one example. Check total PCS power and usable energy separately before deciding how many cabinets are needed.
- Scale & Optimize: For mid-sized projects, evaluate a 422 kWh liquid-cooled platform or a multi-cabinet design. Confirm whether the project uses integrated or separate PCS equipment and verify the total AC power rating.
- Strategic Deployment: For >1 MWh requirements, evaluate the VoyagerPower 2.0 container platform or the PowerMaster multi-MWh platform for multi-feeder operation, campus-level optimization or multi-site rollout.
These product families can act as practical building blocks, but the number on the battery cabinet is only the energy rating. It does not prove that the PCS can supply the required kW. Compare power, usable energy, footprint, interconnection and safety documentation together before selecting a configuration.
6. Example: Turning a Calculation into a Practical System Decision (Usable → Installed)
Site: Manufacturing facility
- Current peak: 1,000 kW
- Target cap: 750 kW
- Typical peak duration above 750 kW: 45 minutes
- Goal: peak shaving first, TOU arbitrage optional
Step A — Power (kW):
Target reduction = 1,000 − 750 = 250 kW → initial battery power ≈ 250 kW
Step B — Usable energy (kWh):
If the full 250 kW reduction is needed for all three 15-minute intervals, duration = 0.75 hours and usable energy ≈ 250 × 0.75 = 187.5 kWh usable. If the measured load changes during those intervals, use the interval-sum formula in Step 3 instead.
Step C — Translate usable energy into installed kWh:
The calculated 187.5 kWh is the energy the site needs at the AC side. For a simplified early screen, assume an illustrative AC delivery factor of 0.90–0.92, an operating window of 0.85 and an early-life capacity factor of 0.98.
Installed kWh ≈ 187.5 ÷ (0.90–0.92 × 0.85 × 0.98) ≈ 245–250 kWh.
Step D — Check whether a real product can meet both numbers:
This screen indicates about 250 kW of PCS power and 245–250 kWh of installed energy. PVB’s integrated 100 kW / 241 kWh liquid-cooled cabinet cannot supply 250 kW as a single unit. Adding cabinets increases both power and energy, so PVB must compare a parallel-cabinet design, a battery cabinet with a separate PCS, or another architecture. The final choice must use model-specific AC deliverable energy, operating limits and warranty data.
The calculation shows an initial power and energy range. Final selection still depends on the exact PCS rating, guaranteed AC deliverable energy, recharge time, site temperature, grid rules, fire-safety layout, redundancy and warranty conditions. The same 187.5 kWh usable requirement can lead to different installed systems at different sites.

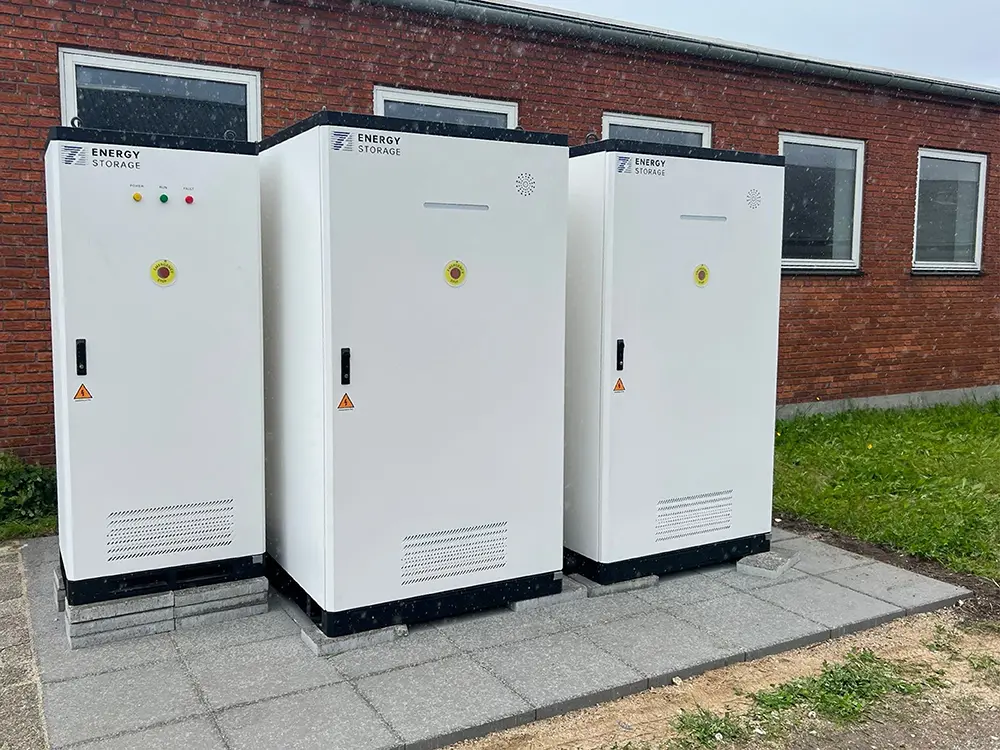
PVB air-cooled modular C&I BESS system
7. Procurement & Contracts: Make Performance Bankable
In 2026 procurement, sophisticated buyers often require performance guarantees, not only hardware warranties. The key difference is simple: a warranty protects you when something breaks, while a performance guarantee protects you when the system under-delivers — even if nothing is “broken.”
For a full contract checklist, see BESS warranty and performance guarantees for C&I buyers.
Warranty vs. Performance Guarantee (Procurement View, 2026)
| Feature | Standard Warranty | Performance Guarantee (Procurement Best Practice in 2026) |
|---|---|---|
| Focus | Defective parts / repair | Guaranteed capacity, system-level RTE, and system availability (uptime) targets |
| SoH Tracking | Opaque / manufacturer-led | Transparent SoH methodology (auditable) + agreed test procedure |
| Data ownership & residency | Often unspecified | Defined data ownership, storage region, access rights, retention, and offboarding handover |
| O&M | Reactive (fix when broken) | Condition-based / predictive capabilities (where available) + workflow/SLA |
| Remedies | Repair or replacement | Service credits / liquidated damages / replacement triggers for underperformance |
Critical contract items (to prevent disputes)
-
SoH methodology (define it upfront)
Specify how SoH is measured and audited: field capacity test vs software estimate, baseline definition, test conditions, audit cadence. -
Performance audit framework
Define acceptance criteria for capacity, efficiency, and availability — and how they will be verified. -
Remedies (make guarantees enforceable)
Service credits, liquidated damages, replacement triggers, and SLA boundaries should be written clearly. -
Data Ownership & Residency (2026 compliance gate)
Clarify who owns performance and energy data, where it is stored (cloud region), who has access rights, retention period, and the handover process upon contract termination. For government, critical infrastructure, and multinational projects, data residency (e.g., no cross-border transfer or region-specific hosting) may be mandatory — and should be explicitly written into the contract.
In 2026, energy data is also ESG data. Ensure the contract guarantees API access to granular charge/discharge and interval performance data to support Scope 2 emissions reporting and carbon accounting/verification workflows. -
Digital O&M maturity
Prioritize platforms that support condition-based / predictive maintenance (where available), with clear workflows (alarm → diagnosis → dispatch → MTTR + spare parts SLA). Monitoring alone is not asset management.
Buyer warning: “Linear Decay” assumptions
Beware of “linear decay” assumptions. Bankable models increasingly use non-linear degradation curves that reflect cycle depth, C-rate, thermal stress, and duty cycle. Your performance guarantee should define the SoH methodology and audit procedure so the guarantee reflects real operating behavior — not an oversimplified Year-1 linear assumption.
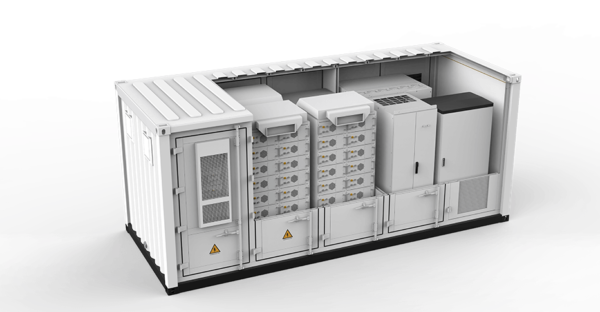
PVB VoyagerPower containerized BESS
8. Additional Checks That Can Change the Final BESS Size
How to Extract 15-Minute Interval Load Data (Practical Tips)
Most C&I sites can obtain interval data through one of three paths: (1) the utility customer portal, (2) the facility’s revenue-grade meter or power-quality meter, or (3) the building management / energy management system. When exporting, request timestamped kW demand in 15-minute intervals for at least 12 months. If the portal only provides hourly data, ask the utility (or your ESCO) whether a meter data request can provide interval-level readings.
Before using the dataset for sizing, verify: continuous timestamps, consistent timezone, and clear handling of missing intervals (flag gaps rather than smoothing). If your site has multiple meters, decide whether you are sizing for total site load or a specific feeder. A clean dataset not only improves ROI accuracy — it also reduces disputes during performance audits.
North America note (where supported): Some utilities support Green Button Download My Data or Connect My Data. These programs can make it easier to export standardized utility-usage data, but the available interval length still depends on the utility and meter.
BESS Fire Suppression & Siting Requirements 2026 (Insurance-Driven View)
For many 2026 projects, the fastest way to “fail late” is to treat safety as a checklist at the end. In reality, siting strategy can dictate cost: spacing, access lanes, ventilation paths, and mitigation measures all influence permitting and insurance terms. Depending on the adopted code and the Authority Having Jurisdiction (AHJ), the project may need evidence related to UL 9540 system certification and UL 9540A fire testing, or the applicable local equivalents, to support insurance review and site permitting.
A practical approach is to run an insurance pre-check during early design: share the preliminary layout, system concept, and safety documentation plan with your broker. If mitigation requirements change later (spacing, barriers, suppression approach), CAPEX and ROI assumptions may shift materially.
Battery Degradation Model for C&I Peak Shaving (What Buyers Should Ask)
Degradation is often where ROI models quietly break. Peak shaving economics assume the system can repeatedly deliver a defined kW for a defined duration. Over time, usable energy and power capability can decline — and if the contract doesn’t define how performance is measured, disputes become likely.
Procurement best practice: require a clear SoH methodology that is auditable. Define whether SoH is validated via field capacity testing, standardized discharge tests, or a software model — and define the acceptance criteria and cadence. Also require visibility into SoH trends (not just SoC), plus an escalation workflow if degradation exceeds limits. Battery-life models should reflect operating temperature, charge/discharge rate, operating window and cycling pattern rather than assuming the same loss every year.
If you are choosing between a 241 kWh vs 422 kWh tier, degradation assumptions can change the “installed margin” you need. For multi-MWh deployments (1 MWh / 5 MWh), degradation planning becomes even more important because performance audits and financing diligence are typically stricter.
Demand Ratchet Impact on Battery ROI (Finance-Friendly Explanation)
Demand ratchets can cause a small number of “bad days” to dominate annual cost. In tariffs with ratchets, one high peak can set a minimum billing demand for future billing periods (sometimes up to 12 months depending on tariff rules). That means missing even one peak-shaving event — due to an empty battery, downtime, or commissioning constraints — can reduce annual savings materially.
In ratchet-heavy tariffs, sizing should include a reliability margin: adequate kW, sufficient recharge capability, and an EMS strategy that avoids “running out of battery” right before the critical interval. CFO-friendly takeaway: ratchets shift the goal from “save on average” to “avoid a few costly exceptions.”
9. What to Send PVB for a Project-Specific Sizing Review
The formulas in this guide create an initial range. To turn that range into a system proposal, send PVB enough information to reproduce the calculation and check whether it will work at the real site.
- At least 12 months of 15-minute site-demand data in kW
- The current electricity tariff, demand-charge rules and contracted grid limit
- Transformer rating, single-line diagram and any export or zero-export requirement
- Operating schedule, known large loads and planned production, HVAC or EV-charging growth
- Solar-system size and interval generation data where PV is installed
- Any critical loads that need backup, including required power and runtime
- Proposed location, ambient conditions and destination-country requirements
PVB’s response should show: recommended PCS power, installed and usable energy, operating reserve, expected recharge window, proposed cabinet or container configuration, EMS priorities, aging and efficiency assumptions, site constraints, warranty basis and the data used in the savings model.
Continue the decision after sizing
After the power and energy range is confirmed, choose the physical format with Battery Storage Container vs. Battery Storage Cabinet.
- BESS
- Battery Energy Storage System — the complete system, not only the battery cells.
- BTM
- Behind the Meter — equipment installed on the customer’s side of the utility meter.
- kW
- Power — how much site load the battery can support at one moment.
- kWh
- Energy — how long the battery can continue supplying that power.
- TOU
- Time of Use — electricity prices that change by time of day or day of week.
- PCS
- Power Conversion System — the equipment that converts battery DC power into AC power for the site.
- EMS
- Energy Management System — the control system that decides when the battery charges, discharges or keeps energy in reserve.
- SoC
- State of Charge — how full the battery is.
- SoH
- State of Health — the battery’s remaining ability to store and deliver energy compared with when it was new.
- RTE
- Round-Trip Efficiency — the share of charged energy that can be returned after system losses.
- AHJ
- Authority Having Jurisdiction — the local body or official that approves code compliance.
- O&M
- Operations and Maintenance — the work required to operate, inspect and service the system.
- SLA
- Service-Level Agreement — the contract terms for response time, repair and service performance.
- MTTR
- Mean Time to Repair — the average time required to restore failed equipment.
- CAPEX
- Capital Expenditure — the upfront cost to buy and install the project.
- ROI
- Return on Investment — the financial return compared with the money invested.
- Demand charge
- A fee based on the site’s highest power demand during a billing period.
- Demand ratchet
- A tariff rule that can use one high peak to set a minimum billed demand for later months.
FAQ: Expert Insights on C&I Storage Sizing
Why is 15-minute interval data a procurement-grade baseline for 2026 projects?
In many markets, utility demand charges are calculated using the highest average demand over a billing interval (often 15 minutes). Hourly data or monthly averages can smooth out short peaks that drive demand charges. Without interval-level granularity, you risk undersizing power (kW) capacity and missing peak-shaving events.
Should I prioritize sizing for Power (kW) or Energy (kWh) first?
It depends on your primary value stream. For Peak Shaving, start with the kW required to reduce demand below a defined threshold. For TOU Arbitrage, sizing is driven by kWh (the volume of energy shifted). In 2026, many bankable designs are sized to support both, enabling diversified ROI under changing tariffs and operational conditions.
How do demand ratchets affect BESS sizing?
A demand ratchet means one high peak can set a minimum billing demand for the next several billing periods (sometimes up to 12 months, depending on the tariff). If ratchets apply, your BESS strategy needs a reliability margin: missing even one peak-shaving event due to an empty battery, downtime, or control constraints can materially reduce annual savings.
What is the difference between “Usable” and “Installed” kWh?
Usable kWh is the energy the site can rely on for operation. Installed kWh is the nameplate capacity. Installed capacity is normally higher because part of the battery is kept outside the operating window, some energy is used or lost before it reaches the AC load, and capacity declines with age. Round-trip efficiency (RTE) is used separately to estimate the energy needed to recharge the battery and the economics of energy shifting.
When should I involve an insurance broker in the sizing process?
Early in the design phase. In 2026, insurability is often a gating factor and depends on siting, fire-code compliance, and safety documentation. If mitigation requirements materially change, insurance terms and premiums can shift enough to alter payback assumptions.
10. References
Codes, tariffs and product specifications change. Confirm the edition adopted by the local AHJ, the site’s actual utility tariff and the current model datasheet before procurement.
- U.S. Department of Energy – Evaluating Your Utility Rate Options — interval data, demand charges and demand ratchets (accessed August 25, 2026).
- U.S. Department of Energy – Battery Energy Storage System Evaluation Method — measuring deployed BESS performance with actual charge and discharge data (accessed August 25, 2026).
- NFPA 855 – Standard for the Installation of Energy Storage Systems — official standard access; use the edition adopted in the project jurisdiction (accessed August 25, 2026).
- UL Solutions – Energy Storage System Testing and Certification — explanation of UL 9540 and UL 9540A (accessed August 25, 2026).
- Green Button Alliance – Download My Data — standardized utility-usage data access where supported (accessed August 25, 2026).
- National Renewable Energy Laboratory – Battery Lifespan — factors used in battery-life prediction (accessed August 25, 2026).