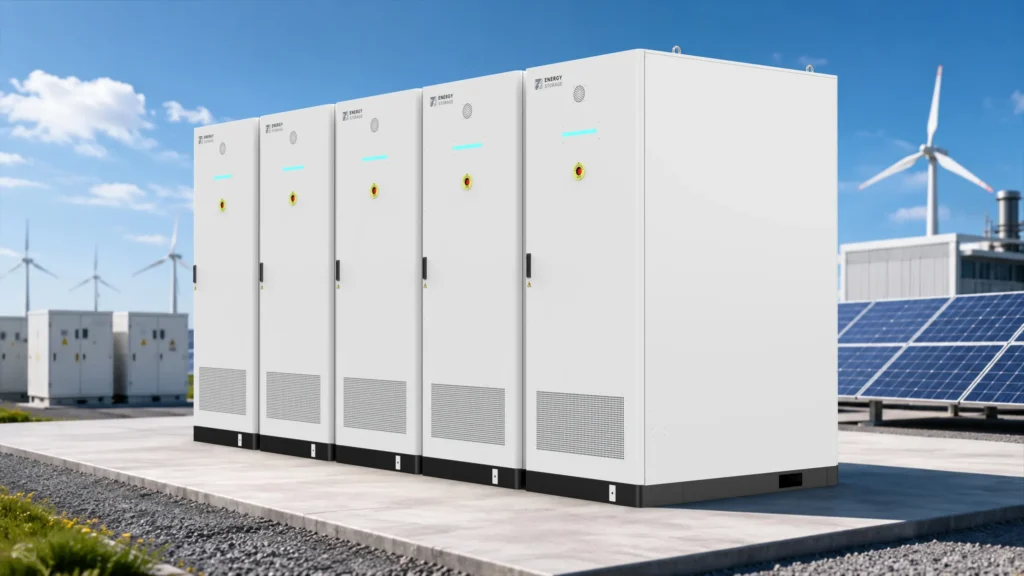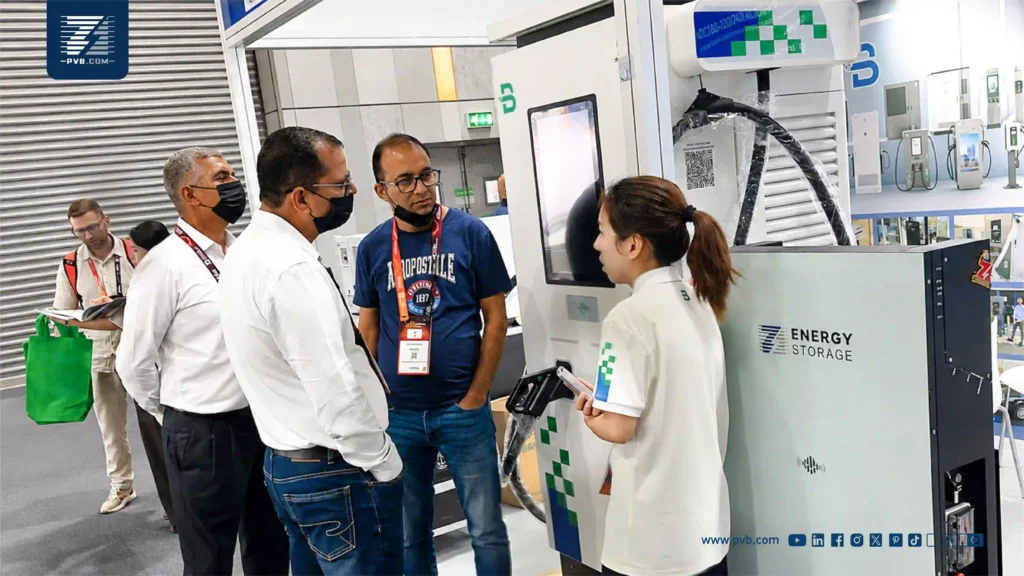
Battery-buffered EV charging can make fast charging possible on a limited grid connection when the shortfall is temporary and there is enough spare power to recharge before the next busy period. Check the largest power gap in kilowatts (kW), then follow the battery’s usable energy in kilowatt-hours (kWh) through a realistic busy day. If the battery cannot recover between charging rushes, reduce or reschedule demand or plan for more supply.
When Battery-Buffered EV Charging Makes Sense
Set the Site Import Limit and Charging Service Target
A battery energy storage system (BESS) can discharge alongside the grid during busy periods and recharge when site demand falls. Start with the import limit approved by the utility at the point where it measures the site’s draw. Identify any tighter transformer, switchboard, or feeder limit on the one-line diagram. If the owner also wants to reduce demand charges, record that billing target separately.
Define what the chargers must deliver within those limits. At a fleet depot, record which vehicles need how much energy before each departure. At a public fast-charging site, define simultaneous port use, the output to be sustained, and the service the operator accepts when demand exceeds the design case. Use vehicle arrival patterns and charge curves to build a busy-day profile. A shared yard with a tight dispatch window can need more short-term power than another site with the same daily energy use.
Compare Managed Charging, Battery Buffering, and a Utility Upgrade
| Option | Where it fits | What to verify |
|---|---|---|
| Managed charging | Vehicles can wait or share power within their parking window. | Priority vehicles still receive the required energy before departure. |
| Battery buffering | Charging demand exceeds the import limit for short periods, with spare supply between or after them. | The battery supports each planned rush and can recover before the next required service window. |
| Utility upgrade | High demand lasts longer than the buffer can support, or the site regularly lacks enough energy to refill it. | The utility can deliver the required capacity and the site’s distribution equipment can carry it. |
These approaches can work together. For example, managed charging can spread flexible sessions across a shift while a smaller battery covers vehicle departures that cannot move. If available grid and onsite energy regularly fall short of what vehicles and the facility consume, the battery will lose charge across operating cycles. See the Joint Office feasibility model.
Size the Buffer in kW and Usable kWh
Put Charger Input and Site Loads on the Same AC Boundary
For a separate AC-coupled battery, compare loads and supply at one alternating-current (AC) measurement point. Use the chargers’ AC input, which includes conversion losses between the supply and the vehicle. Add concurrent facility demand and any auxiliary loads that neither reading includes, such as battery cooling. Use gross load readings with separately metered solar output, or start from a net load profile that already accounts for generation. Check any downstream equipment limits separately using the loads and sources at that point. See PVB’s BESS grid connection guide.
Battery discharge needed (kW) = charger AC input + facility and auxiliary loads − simultaneous onsite generation − allowed import, with any negative result treated as zero.
Check Peak Discharge Power and Usable Energy
The highest gap sets the starting point for the battery’s sustained AC discharge rating. Add up the kWh supplied by the battery across the peak, then track how much the battery can restore before the next one. Compare the result with the guaranteed usable AC energy at the agreed measurement point. Confirm the allowed operating range, minimum state of charge (SoC), temperature limits, and end-of-warranty performance. Specify the energy reserved for another purpose, such as backup, before counting the rest for EV charging. See PVB’s interval-based sizing guide.
Utility interval data helps establish facility demand over time. When short charging overlaps or control response matter, use session data and readings at a finer interval. Model realistic charger sharing and vehicle taper. Verify the import cap and equipment limits with the design team for the shortest relevant interval. See Sandia’s fast-charging site modeling study.
Test Whether the Buffer Can Serve a Second Charging Rush
Model Two Charging Rushes and the Recharge Window
Consider a site with an approved import limit of 250 kW, 70 kW of steady facility and auxiliary loads, and no solar contribution. The charging area therefore has 180 kW of grid headroom. The battery starts with 90 kWh of usable AC energy available to support the chargers and can sustain the required discharge power. All figures are illustrative, use the same AC boundary, and assume no further equipment limits.
| Window | Charger input | Battery action | Energy remaining or shortfall |
|---|---|---|---|
| First rush | 300 kW | Discharge 120 kW for 30 minutes, delivering 60 kWh. | 30 kWh |
| Between rushes | 150 kW | Use up to 30 kW of spare grid power for 30 minutes. | At most 45 kWh before recharge losses |
| Second rush | 300 kW requested | The full service target needs another 60 kWh of battery discharge. | At least 15 kWh short of the target |
Check State of Charge Before the Next Rush
The battery can deliver the first rush in full. By the start of the second rush it has at most 45 kWh available, since half an hour at 30 kW can take in only 15 kWh before losses. At 120 kW discharge, that covers at most 22.5 minutes of the second 30-minute window. The controller has to reduce or defer some charging to keep import within the limit.
Under these assumptions, the two rushes require at least 105 kWh of starting usable AC energy before recharge losses. A real proposal needs to account for the charge rating and conversion losses, operating reserve, and any lower power limits at that SoC or temperature. Run the full operating schedule through the next required start time. A design that serves one busy day must have enough time and supply to restore its starting energy before the next comparable shift. See the Joint Office design-day method.
What the U.S. Model and the German Installation Show
U.S. Corridor Model: Storage for a Specific Design Day
A Joint Office and NREL feasibility study modeled a proposed U.S. corridor site with four 150 kW ports and 125 kW of grid-supported power expressed on the model’s DC basis. The modeled design day dispensed 1,632 kWh to vehicles over 24 hours, equivalent to 68 kW on average. The study recommended at least 480 kWh of storage for that site. The result depends on the corridor charging profile, first-hour service criterion, and recharge assumptions used in the model. Other sites need their own interval data and service targets. See the modeled case and its reference tables.
German Logistics Site: Published Equipment Ratings
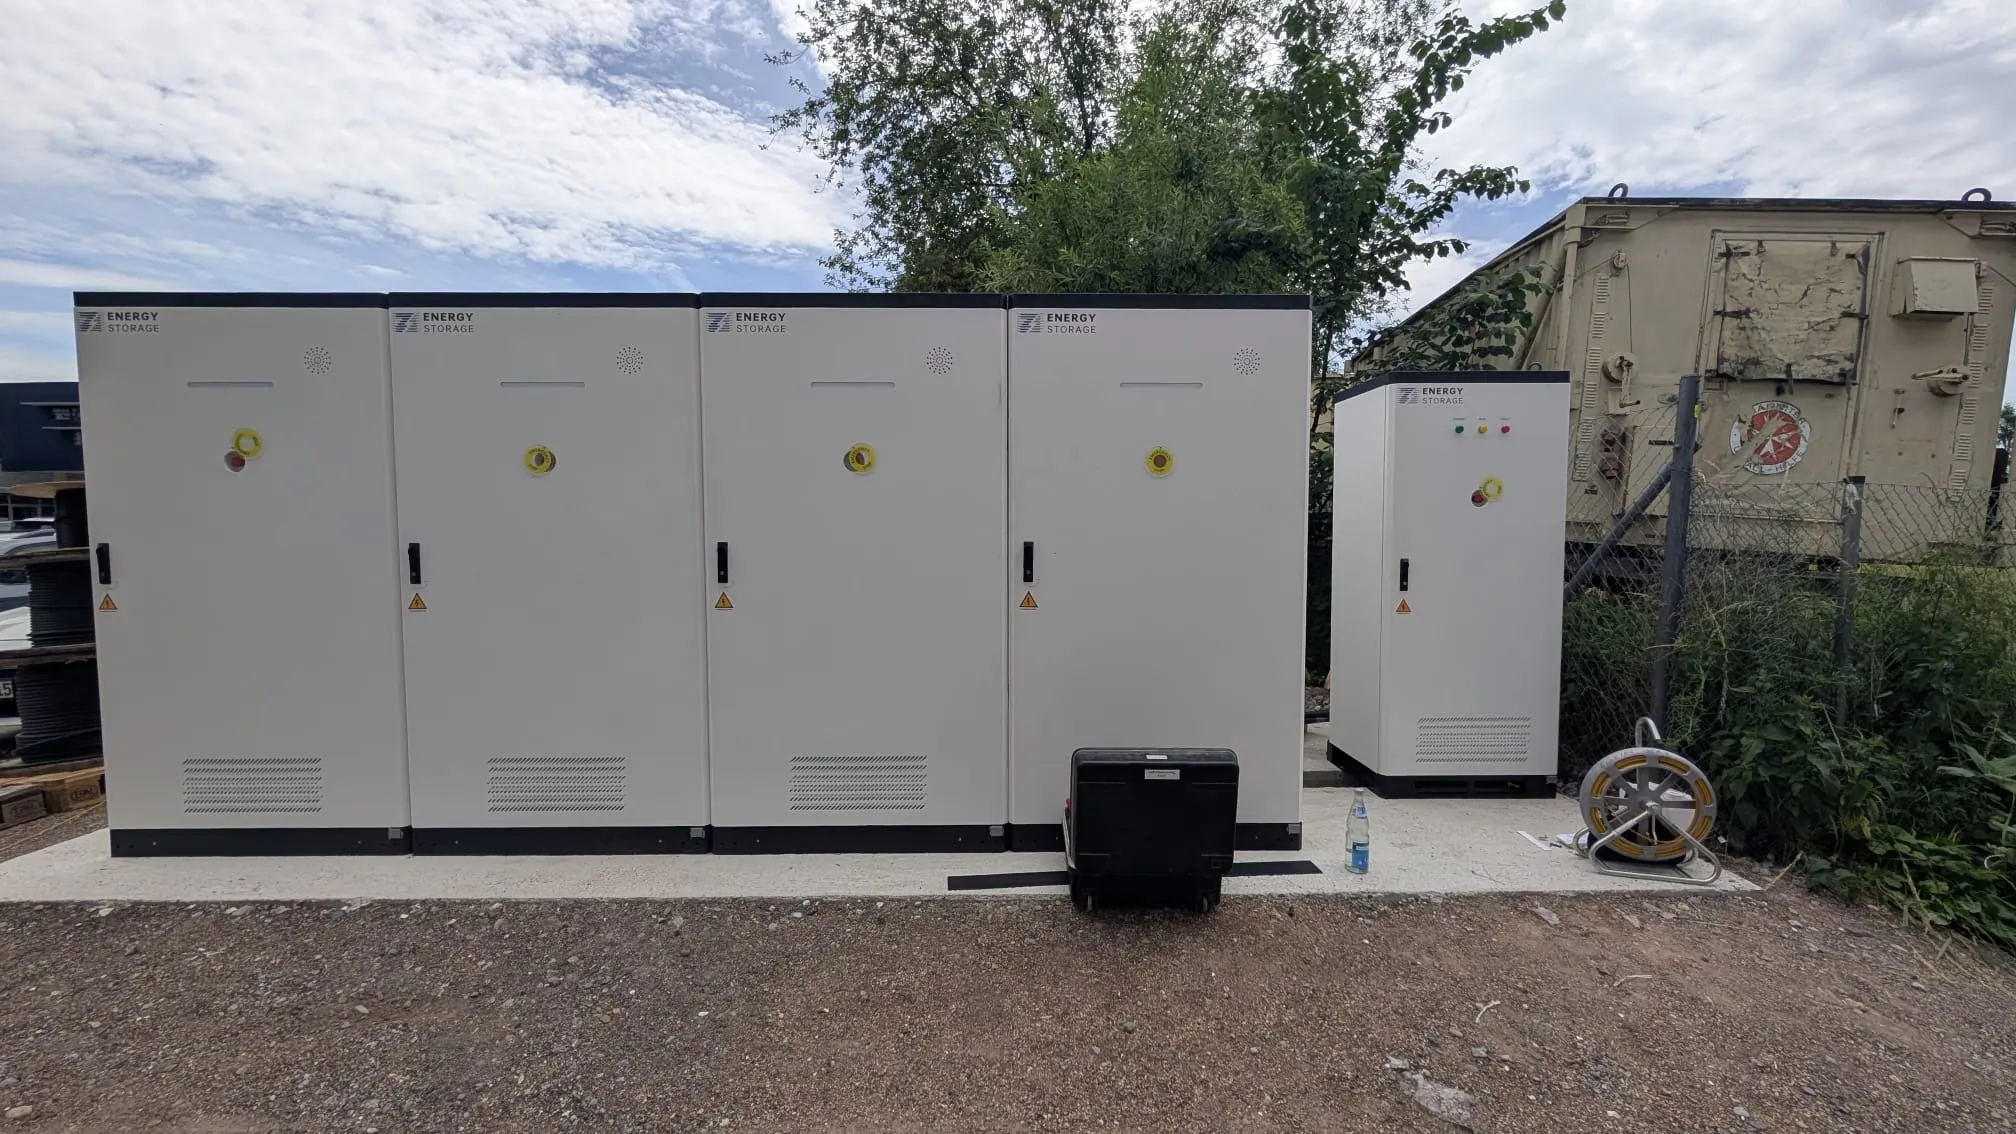
PVB’s German logistics project documents four 100 kW / 241 kWh air-cooled cabinets and an AC parallel cabinet. The four storage cabinets provide about 964 kWh of nominal DC battery energy and 400 kW of aggregate rated power conversion system (PCS) capacity. The five EVB chargers are each rated up to 360 kW. Their combined 1.8 MW nameplate total describes the equipment ratings. PVB’s published case leaves the actual import cap, usable AC energy, measured simultaneous charger output, and achieved savings undisclosed. See the PVB project and equipment list.
Specify Controls and Commissioning Tests
Define Charging Limits at Low State of Charge
Ask the integrator to show which site meter supplies the import reading, which controller commands the chargers and battery, and how the controls prioritize vehicles as the battery approaches its minimum SoC. Agree on a reduced-output mode and who can change it. Define the fallback if the battery is unavailable, the site meter or communications stop reporting, or facility demand rises unexpectedly. The fallback needs to keep the site within its approved limits.
Verify Site Import, Port Output, and Battery Recovery
Test a representative operating sequence against written pass criteria. Use synchronized records of site meter power, battery AC power, state of charge, and power and energy delivered per active port. Give the following checks to the project team before the equipment is ordered.
- First and second rushes. Confirm the agreed simultaneous port service in both windows and verify site import using the agreed measurement interval.
- Limited battery operation. Start from the specified low SoC or simulate a battery-unavailable state under the approved procedure. Confirm charger output is limited as designed and priority vehicles receive the agreed service.
- Recovery. Observe the time and AC energy needed to reach the target SoC. Verify that the recharge period stays within the import and equipment limits, including when facility load resumes.
Evaluating a battery buffer for a charging site? Send your import limit, available site load data, expected charge windows, and the minimum service you need to maintain. Contact PVB about a commercial storage configuration.
References
- Joint Office of Energy and Transportation and NREL. Grid-Constrained Electric Vehicle Fast Charging Sites and the reference table assumptions. Accessed November 16, 2026.
- Joint Office of Energy and Transportation. Battery Energy Storage for Electric Vehicle Charging Stations. Accessed November 16, 2026.
- Sandia National Laboratories. Sizing Behind-the-Meter Energy Storage and Solar for Electric Vehicle Fast-Charging Stations. Accessed November 16, 2026.
- PVB Energy Storage. German Logistics Battery Storage and DC Charging Project. Accessed November 16, 2026.